INSPECTION INTELLIGENCE / POWER BI
AVISpect Reporting.
Evidence you can act on.
Turn captured evidence into a reviewed record: a unique location, a clear anomaly description, its extent, criticality and recommended response. Microsoft Power BI brings priorities, trends and action closure into view.
Explore the interactive specimen report
From portfolio view to individual finding.
Demonstration only. These four invented records explain the reporting workflow. They are not inspections undertaken by Drone Alliance.
A finding should be traceable. Agree source evidence, location references, measurement basis, review status and action history as part of the reporting scope.
PORTFOLIO TOTALS · ALL SAMPLE FINDINGS
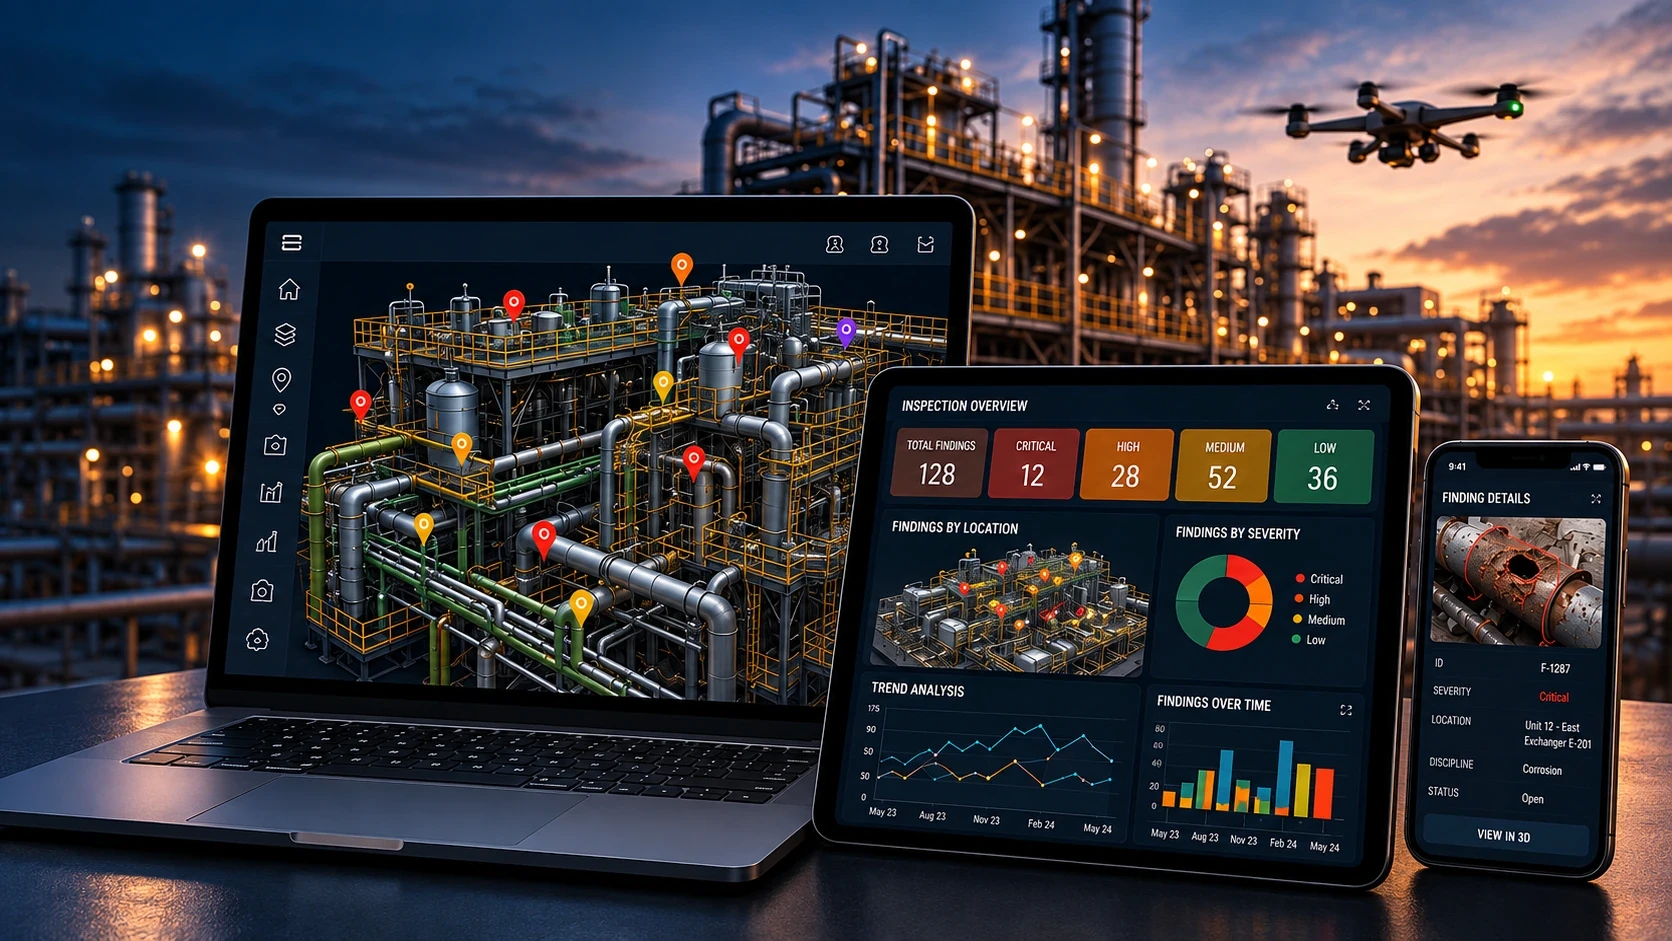
Agree criticality criteria with the client and relevant asset specialist. Keep the observed condition, measurement basis, recommended response and review status distinct, so each decision can be traced to its supporting evidence.
Engage complete capture and reporting, submit suitable data for reviewed reporting, or build a repeat inspection programme.
Discuss AVISpect ReportingAVISPECT REPORTING / PLANNED FREMANTLE DEMONSTRATION
One arch.
One connected workflow.
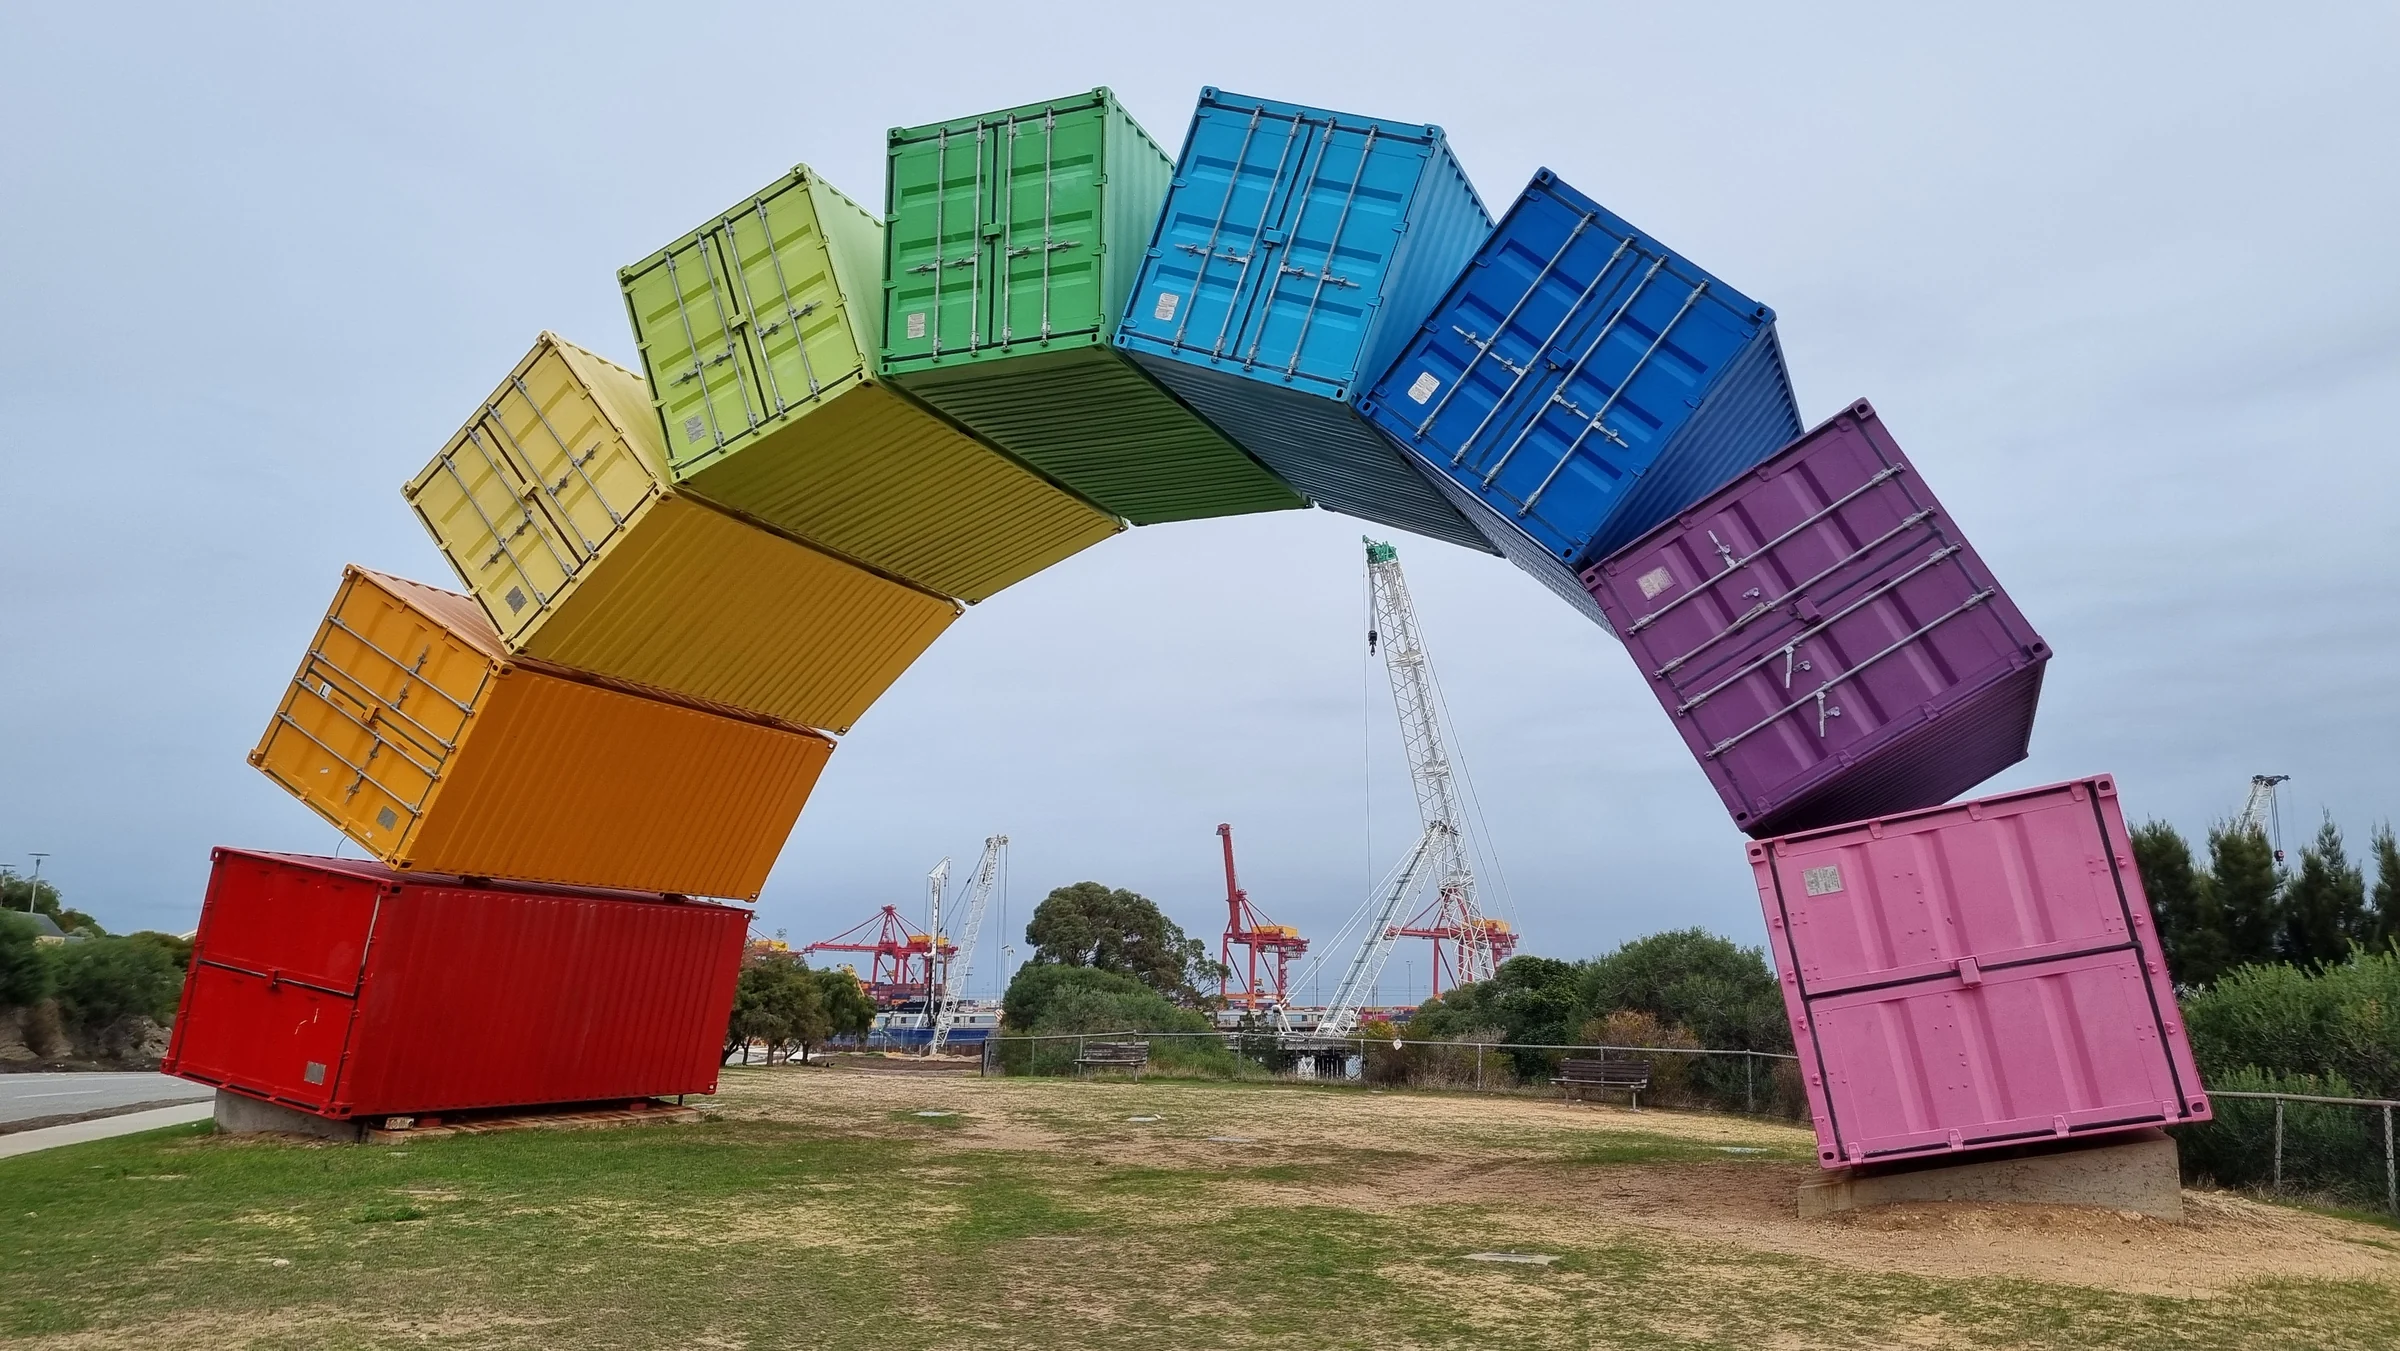
The Fremantle Rainbow container arch illustrates the planned connection between Light Detection and Ranging (LiDAR) geometry, photogrammetry, Remote Digital Visual Inspection (RDVI) and AVISpect Reporting. Follow the proposed workflow from capture to reviewed findings and Power BI metrics.
to a richer asset record.
Capture the geometry
Plan scan coverage, capture the structure and validate the point cloud against the agreed control and quality requirements.
Build the visual model
Capture overlapping imagery, build a textured three-dimensional (3D) model and check its alignment with the spatial reference.
Locate each finding
Review visual evidence and record unique location, anomaly description, extent or dimensions, criticality and recommended response.
Review. Report. Track.
Review findings and measurement confidence, issue the report, then use Power BI metrics to track priorities, actions and closure.
Field capture, access arrangements and the resulting model are still to be completed. This feature presents the proposed workflow; it contains no measured results or actual findings for the sculpture.
Discuss this workflow for your asset